Like Cats and Dogs
Why model selection and inference just can’t get along
Peter Humburg
18 February 2021
Model Selection and Inference

The Problem
Standard statistical inferences are often carried out based on a model that is determined by a data-driven selection criterion. Such procedures, however, are both logically unsound and practically misleading.

A Closer Look
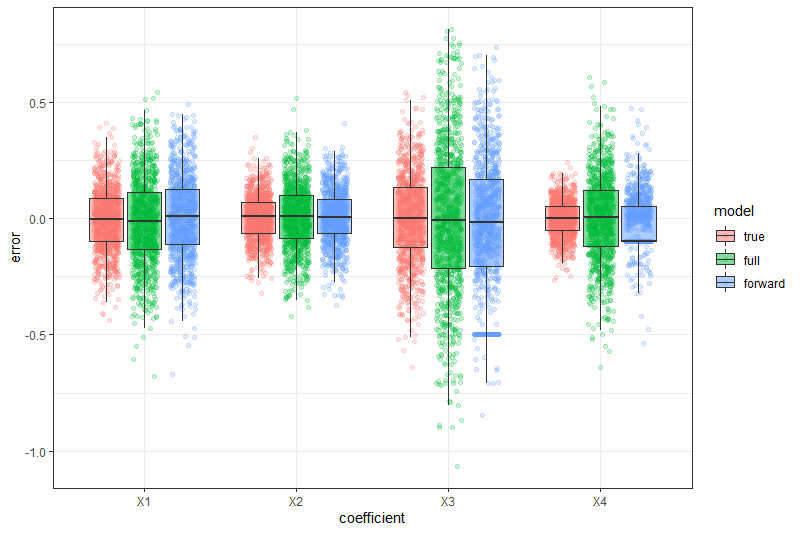
What is the effect of model selection on coefficient estimates?

Estimates
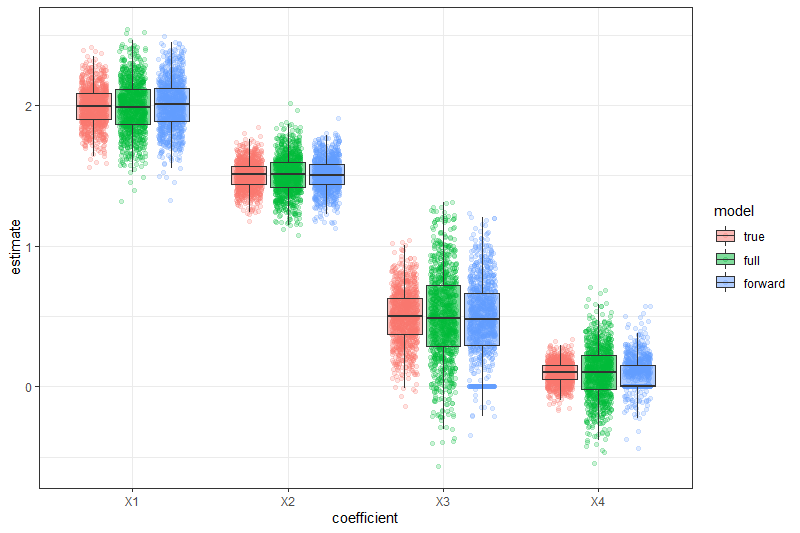
Estimates
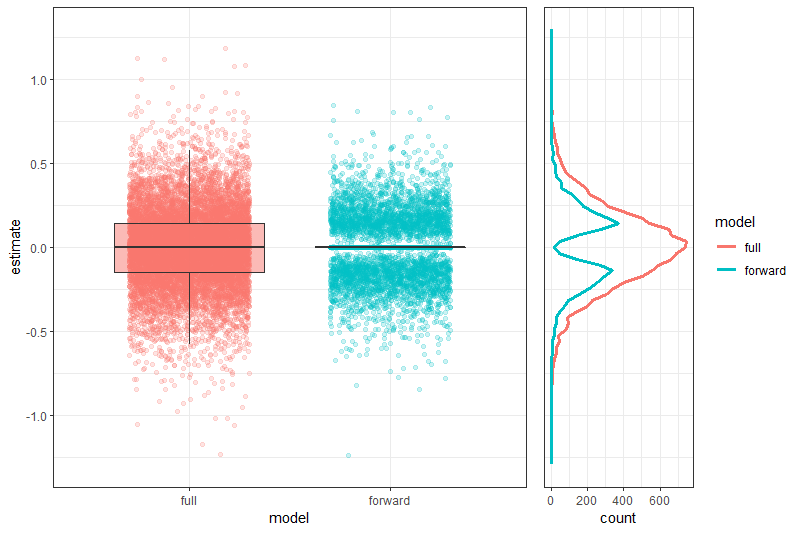
Estimates for 0 coefficients
Can we make it work?